The Ultimate Guide to Understanding Crypto Trading Charts
In the rapidly evolving world of cryptocurrency, understanding trading charts is crucial for traders looking to make informed decisions. Crypto Trading Charts are powerful tools that provide visual representations of price movements and market trends, serving as essential resources for both novice and experienced traders. This article delves into the components of crypto trading charts, their significance, and how to effectively utilize them in trading strategies. For more insights on cryptocurrency developments, you can check out this [source](https://www.globenewswire.com/news-release/2018/08/03/1546969/0/en/Web-Global-Holdings-Inc-Announces-Discussions-Underway-On-Long-Term-Advertising-Contracts-With-Several-Of-The-Largest-Cryptocurrency-Companies-In-The-World.html).
Understanding the Basics of Crypto Trading Charts
Crypto Trading Charts offer a visual representation of the price history of a cryptocurrency over time. These charts can display various timeframes, from minutes to years, and are typically used to identify trends, patterns, and potential entry and exit points for trades. The most common types of charts are line charts, bar charts, and candlestick charts, each providing unique insights into market behavior.
Line Charts
Line charts are the simplest form of charts, connecting the closing prices of a cryptocurrency over a specified time frame. They provide a clear visual representation of price movement but lack detailed information about highs, lows, and opening prices.
Bar Charts
Bar charts offer more information than line charts. Each bar represents the opening, closing, high, and low prices for a given time period, allowing traders to assess market volatility and momentum more effectively.
Candlestick Charts
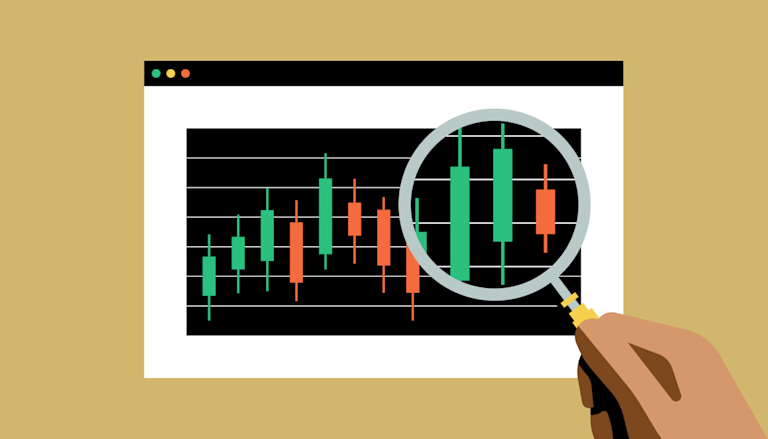
Candlestick charts are widely popular among traders due to their ability to convey more information clearly. Each candlestick shows the open, close, high, and low prices within a specified time frame. The body of the candle indicates the open and close prices, while the wicks (or shadows) indicate the high and low prices. Traders use candlestick patterns to identify trends and potential reversals in the market.
Importance of Analyzing Trading Volumes
Alongside price data, trading volume is another critical factor to consider when analyzing crypto trading charts. Volume indicates the total amount of a cryptocurrency traded over a specific period. High trading volumes suggest strong market interest and can validate price movements. For example, if a price increase is accompanied by high volume, it indicates strong buying pressure and may signal a continuation of the trend.
Key Indicators for Crypto Trading Charts
Technical indicators help traders analyze chart patterns and predict future price movements. Some commonly used indicators in crypto trading include:

Moving Averages
Moving averages smooth out price data to identify trends over specific periods. The Simple Moving Average (SMA) and the Exponential Moving Average (EMA) are popular choices among traders. SMAs calculate the average price over a specified number of periods, while EMAs give more weight to recent prices, making them more responsive to changes.
Relative Strength Index (RSI)
The RSI is a momentum oscillator that measures the speed and change of price movements. The RSI ranges from 0 to 100 and is typically used to identify overbought or oversold conditions. An RSI above 70 may indicate that a cryptocurrency is overbought, while an RSI below 30 suggests oversold conditions.
Bollinger Bands
Bollinger Bands consist of a middle band (SMA) and two outer bands that represent price volatility. When prices approach the upper band, it may signal overbought conditions, while approaching the lower band may indicate oversold conditions. Traders often use Bollinger Bands to identify potential price reversals or continuations.
Developing Your Crypto Trading Strategy
Developing an effective trading strategy involves utilizing crypto trading charts and indicators to make informed decisions. Here are a few tips for crafting your strategy:
Define Your Goals
Before diving into trading, define your investment goals and risk tolerance. Determine whether you are looking for short-term gains or long-term investments, which will influence your trading strategy and the charts you focus on.
Utilize Multiple Time Frames
Analyzing multiple time frames can provide a more comprehensive view of market trends. For instance, use a daily chart to identify long-term trends and a 4-hour or hourly chart for entry and exit points.
Stay Updated with Market News
Crypto markets are influenced by market news, regulatory changes, and technological developments. Staying informed will help you anticipate price movements and adapt your trading strategy accordingly.
Conclusion
Crypto Trading Charts are indispensable tools for anyone involved in cryptocurrency trading. By understanding how to read these charts and effectively analyzing price movements, traders can enhance their decision-making processes and improve their chances of success. As the cryptocurrency landscape continues to evolve, ongoing education and adaptation to new trends will be crucial for traders looking to thrive in this dynamic market.
